Māehe Manawa Ora Movin'Records
We've counted over 1 million walking and wheeling trips to school! Will you be part of the next million trips?
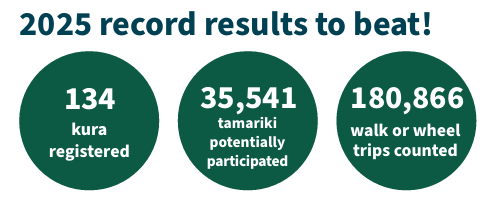
Movin'March 2026 sets the standard
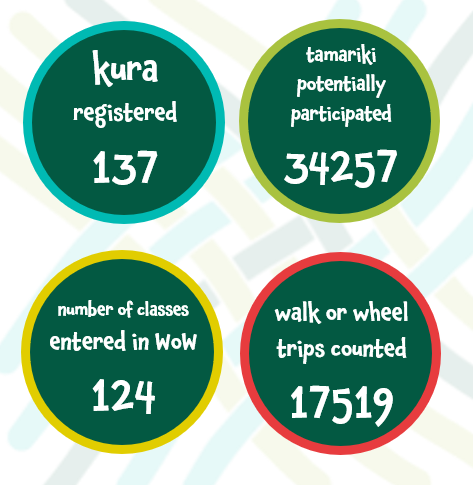
In 2026, 137 schools took part in Movin'March, only one of our record number of 138. We're super impressed at all the dedicated kaiako, who despite being super busy, are also super committed to our journey (and maybe getting a few cool prizes!).
Two of these were taking part for the first time, and an amazing SEVEN school have taken part every year since 2013 (earlier records are still being translated from the ancient runes)!
Our estimates (or Education Counts data) suggest that around 34,257 students potentially took part in this years activities. And of those, a brave and bold 124 classes entered the new WoW Challenge.
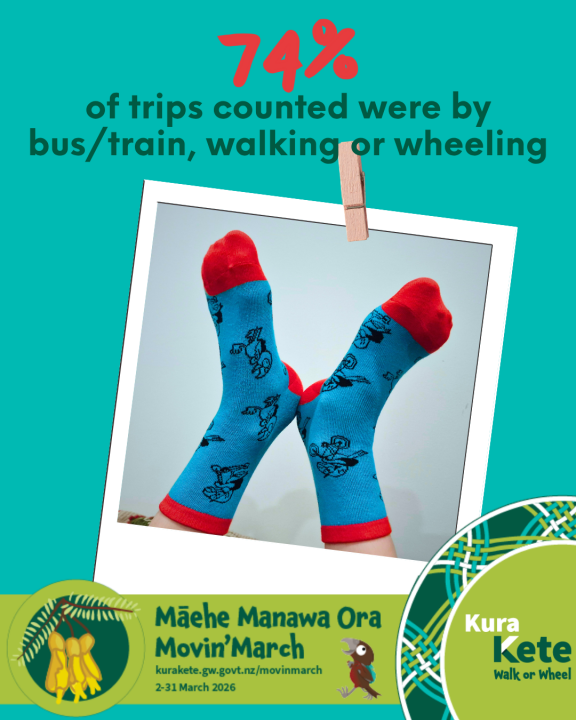
In 2026, we tallied around 23,000 trips of which 17,519 were walking or wheeling and public transport or park and stride trips. That's about 74%!
That's pretty cool when normallyopen_in_newopen_in_new across our region around 49% of trips to education are driving/driven. Movin'March schools beat that by 23%! Ka rawe!
More Movin'March 2026 details
Check out some of the data you shared with us during Movin'March 2026.
We know change is hard, and sometimes, not for the better. Some teachers loved the wallcharts, and think they worked well. Others told us they really really missed the passports! So, who knows, the passports may be back in 2027! *fingers crossed emoji*
Despite the new-ness, and the busy-ness of our favourite people (that's you, teachers!), around 124 classes took part this year, and over 60 completed our survey - providing valuable insights to help us improve again for next year.
Our very rough, very 'back of the napkin' calculations, work out that this represents around 6.67% of classes taking part, so if everyone had entered trip data, we'd have over 250,000 active trips recorded! (Or something like that).
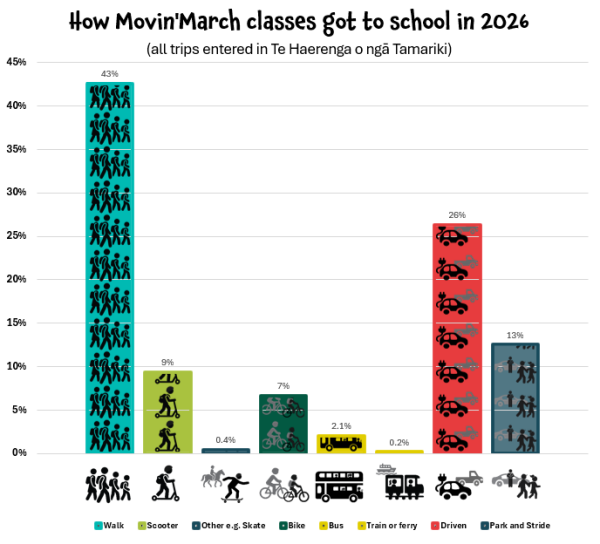
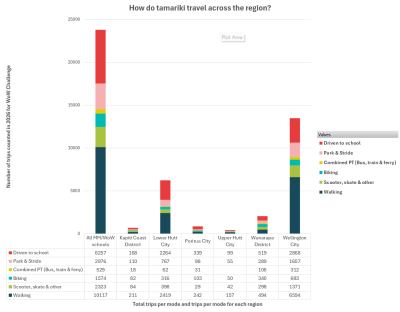
Around 23,000 trips were entered in Te Haerenga o ngā Tamariki during Movin'March 2026.
We added up all the trips to see how the classes taking part in the WoW Challenge got to school.
- No surprises that walking came out tops - it's easy, fun and you can chat with your whānau or friends!
- Scooters and bikes were popular too, but the Park and Stride option just nudged them out.
- Park and Strideopen_in_new is a great alternative for those who live a bit far away or have tricky intersections or steep roads to travel. And for those parents who need their car for work. It gives tamariki a taste of independence while learning road safety skills. And reduces congestion at the school gate (and the added stress to drivers!).
Overall, around 74% of all trips recorded were active or sustainable. That's an awesome effort!
The count for Wellington in the 2023 census was closer to 50%.
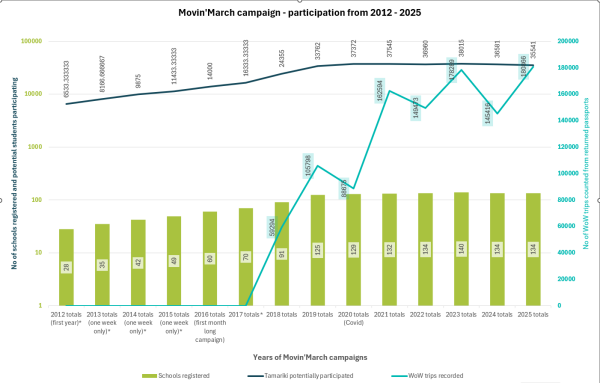
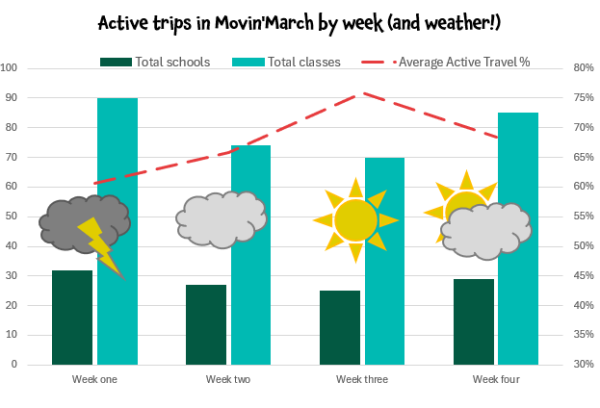
We added the total recorded active and public transport trips for each week of Movin'March. Then looked at what the weatheropen_in_newopen_in_new was doing each week.
The bars on the graph show how many schools and classes took part each week, while the red line shows the percentage of all active trips entered for that week.
- Week 1 had some very wet and windy days.
- Week 2 was better but several rainy days.
- Week 3 was mostly fine.
- Week 4 was not as sunny as week 3, but mostly fine.
What would your class results look like?
Use Te Haerenga o ngā Tamarikiopen_in_new to find out!
Note: there is of course or 'self-selection biases'open_in_newopen_in_new in these results. Only the classes who were promoting Movin'March will have taken part.
We're impressed with all schools around our rohe, but we know you all have unique environments and this impacts how you get around.
So what did we learn about each region in 2026?
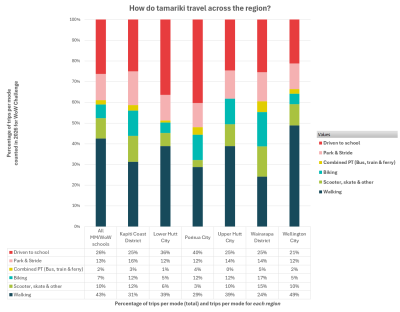
- Wellington City topped the walking stats, with 49% of trips entered being walking. Lower Hutt and Upper Hutt were close behind with 39% each.
- Kāpiti schools love their Park and Stride (16%)! Just edging out Wairarapa and Upper Hutt who both had 14% of trips tagged to Walking Pou.
- The biggest bikers came from the Wairarapa with 17%! Kāpiti, Porirua and Upper Hutt weren't far behind with 12% each.
- And Wairarapa also topped the Scooter stats at 15%. Kāpiti followed with 12%, while Upper Hutt and Wellington both had 10%.
- Public transport (buses, trains and the ferry) were the least popular across all our rohe, with no more than 5% of trips and an average of around 2%. Will that change over winter though?
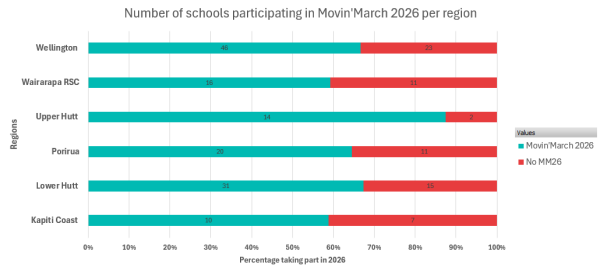
- Upper Hutt had the highest percentage (87.5%) of schools taking part. While Wellington had the highest number (46). Hutt City isn't far behind on both scores though, with 31 schools taking part which makes up 67%.
If your class could choose how they got to school, what would come out on top?
How does that compare with how they actually get to school?
And what factors influence their choice, or their actual trips?
Quick history of Movin'March
History
Movin'March started way back in 2009 or 2010 (so long ago that there is no written record!). It was a one week event in a handful of schools. By 2016 it became a month long event and 60 schools (30%) across the region took part. That included about 14,000 students and they submitted over 19,530 trips on their passport cards (not all schools sent these in).
Since then, Movin'March has continued to grow; since 2019 between 125 and 140 schools have taken part each year (63-70% of all primary schools).
Today
In 2025, we reached a total of over 1,000,000* WoW Passport card trips counted! That's a million walking and wheeling trips made by the awesome tamariki of Te Upoko o te Ika a Māui in the past 9 years. Ka rawe!
About 86% of schools across the region with Y0-8 students have taken part at least once, and we estimate** over 106,000 ākonga have had a chance to participate in Movin'March – that's almost 2% of the population of Aotearoa!
* This includes only cards returned to GW by the competition deadlines since 2016
** Non-scientific calculation to try and count students only once, even when their school takes part multiple times. Otherwise, we'd have over 350,000 potential tamariki 'participations'.

More background
Waka Kotahi NZTA estimates the health benefits of walking (for 'new users') at $4.40 per km! Cycling comes in at $2.20 per km travelled! (Source: NZTA, 2020open_in_newopen_in_new). With almost half of primary school students in Wellington City alone travelling more than 1km to school, this would quickly add up to amazing benefits - if we can make it fun, safe and easy for kids to walk (Molijn, 2023open_in_newopen_in_new). Because distance to school is also the strongest determinant on mode choice (Mandic, 2023open_in_newopen_in_new).
Auckland Transport has a cool worksheetopen_in_newopen_in_new showing the benefits of active travel as part of their Let's go thereopen_in_new resource.
AT have also collected together a range of 'proof pointsopen_in_newopen_in_new' providing evidence of all the various benefits of active travel to school. This includes who it improves health, supports mental health, and helps kids learn.
In 2023/24 only around 32.4% of kids aged 5-9 used active modes to get to school (EHINZ, 2025open_in_newopen_in_new). This percentage increases slightly for tamariki aged 10-14 (44.9%), but nationally this number has been decreasing since 2011.
Our data gurus have looked at the census data from 2018 and 2023, and compared these numbers across schools that took part in Movin'March vs those who didn't. While the non-Movin'March schools followed the national trend (dropping by 3-6%), we found that our Movin'March schools not only maintained their active travel levels, but also had about 10% more active travellers to begin with!
Movin'March really is making a difference!